Hello guys, I am back after a long time. I was learning Microstrategy during last one year. So, here I am, writing something on mstr.
Today, I am writing about a problem that almost every mstr developer faces. Let’s say, you have two base metrics: dollars and units. Now, you like to calculate Market Share (MS) based on these two base metrics. Everything stays fine up to this point. But, problem starts at dashboard or document side. It is very likely that your client would like to have one selector in web document to choose between dollars and units. And MS should be calculated based on his selection (either dollars or units). Given below is a snapshot which will make everything clear.


Usually, this problem is solved by using panels with a panel selector. For two base metrics, you have to take two identical panels. Both panels will be exactly same from visualization point of view. But, they will be using two different metrics. One panel will use MS_Dollars and the other one will use MS_Units. That means, whenever you need to change anything, you have to do it in two places. Imagine what would happen if you have three or four base metrics? You will end up copying the same panel three or four times. In one of my projects I had six identical panels (yuuuk..)!
Following is my workaround to avoid creating multiple identical panels; although with a small glitch…
- Add one table called DimFlag into warehouse catalog. It will contain two records: ‘Units’ and ‘Dollars’

2. Create an attribute called Flag. This attribute doesn’t have any relationship with any other table in my schema.

3. Create a metric called Flag using the attribute created in previous step.

4. Create one metric called MyMeasure. This metric holds key to our solution. This metric returns Dollar metric if Dollar is selected from flag attribute and it will return Units metric if Units is selected from flag attribute. Note that Flag ID has been used in if condition instead of flag description.

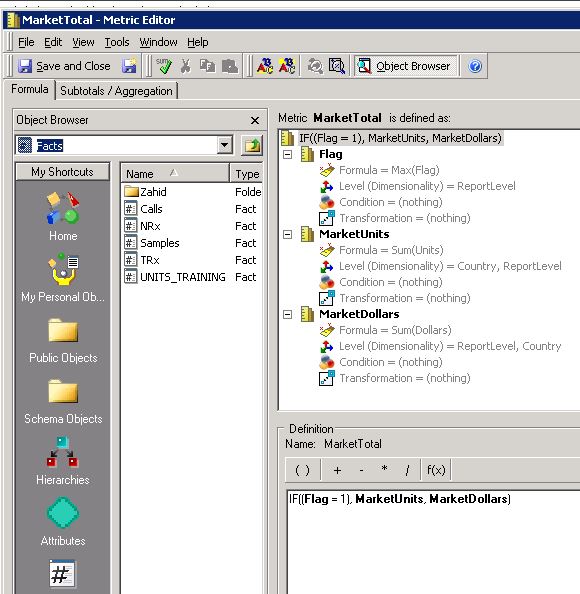
5. By the way, we have another attribute called country. We want to show each country’s sales (dollar or units) and its corresponding share (%) in our web document. We need to use level dimensionality to derive ‘market sales in units’ and ‘market sales in dollars’ first. When I say ‘market’, I mean summation of all available countries. So, our level dimensionality will make sure Country attribute is ignored as ‘filter’ and ‘GroupBy’. This level dimensionality is not related to our main solution. Our main trick is the ‘if’ condition that was demonstrated in previous step. Finally, we will create another wrapper metric called ‘Market Total’ which will contain an ‘if’ condition just like the one in ‘MyMeasure’ metric created in previous step.
6. Now, we are ready to create a dataset. Given below is a snapshot of our dataset. If you look at corresponding generated SQL, you will notice a cross-join. It’s because Flag attribute is not connected anyway to our facts. This is the small glitch I was talking about. But, we can live with a cross-join for small scale projects where data volume is not that big and generated SQL is also simple.

7. We are almost done. All you have to do is to import this dataset into your document. Create a selector from Flag attribute, create a grid table using MyMeasure and MarketTotal metric and Country attribute. Finally, make this grid a target for your Flag selector. Metrics calculation will happen based on your selection in selector as per the ‘if’ condition defined inside Metric definitions.
Hope you’ve understood my idea. Get back to me for any question.
